
At IJYI we use and recommend the Microsoft Power Platform for our Data Services. Microsoft PowerBI will enable you to:
- Reduce cost, complexity and the challenges of multiple analytics systems
- Connect to all your data and get a consolidated view across your entire business
- Create ad-hoc analysis, live dashboards and interactive reports that are easy to consume on the web and across mobile devices
- Allow everyone in your organisation to make confident decisions based on up-to-the-minute analytics
- Grow and evolve with a scalable, secure and compliant platform
It is a fantastic tool but, as with most things in the world of technology, there are lots of buzzwords associated with PowerBI so we thought it would be useful to take a quick run through the key ones:
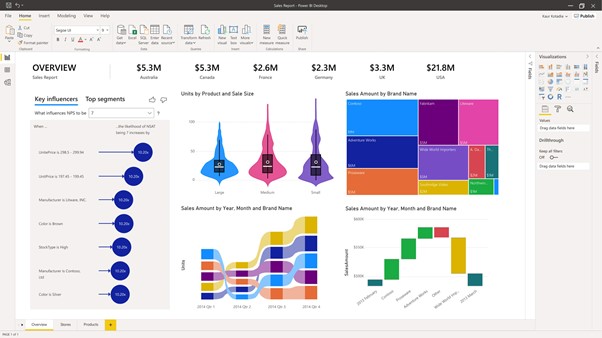
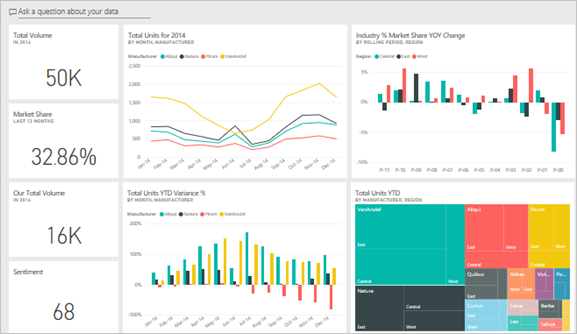
Visualizations
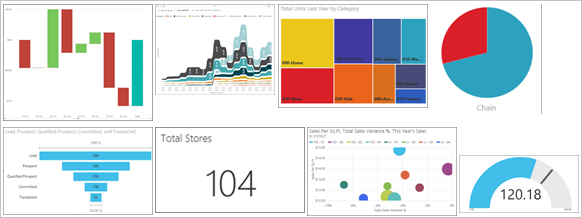
Visualizations (also known as visuals) display insights that Power BI discovers in the data. Visualizations make it easier to interpret the insight, because your brain can comprehend a picture quicker than a spreadsheet of numbers.
Just some of the visualizations you’ll come across in Power BI are: waterfall, ribbon, treemap, pie, funnel, card, scatter, and gauge.
Datasets
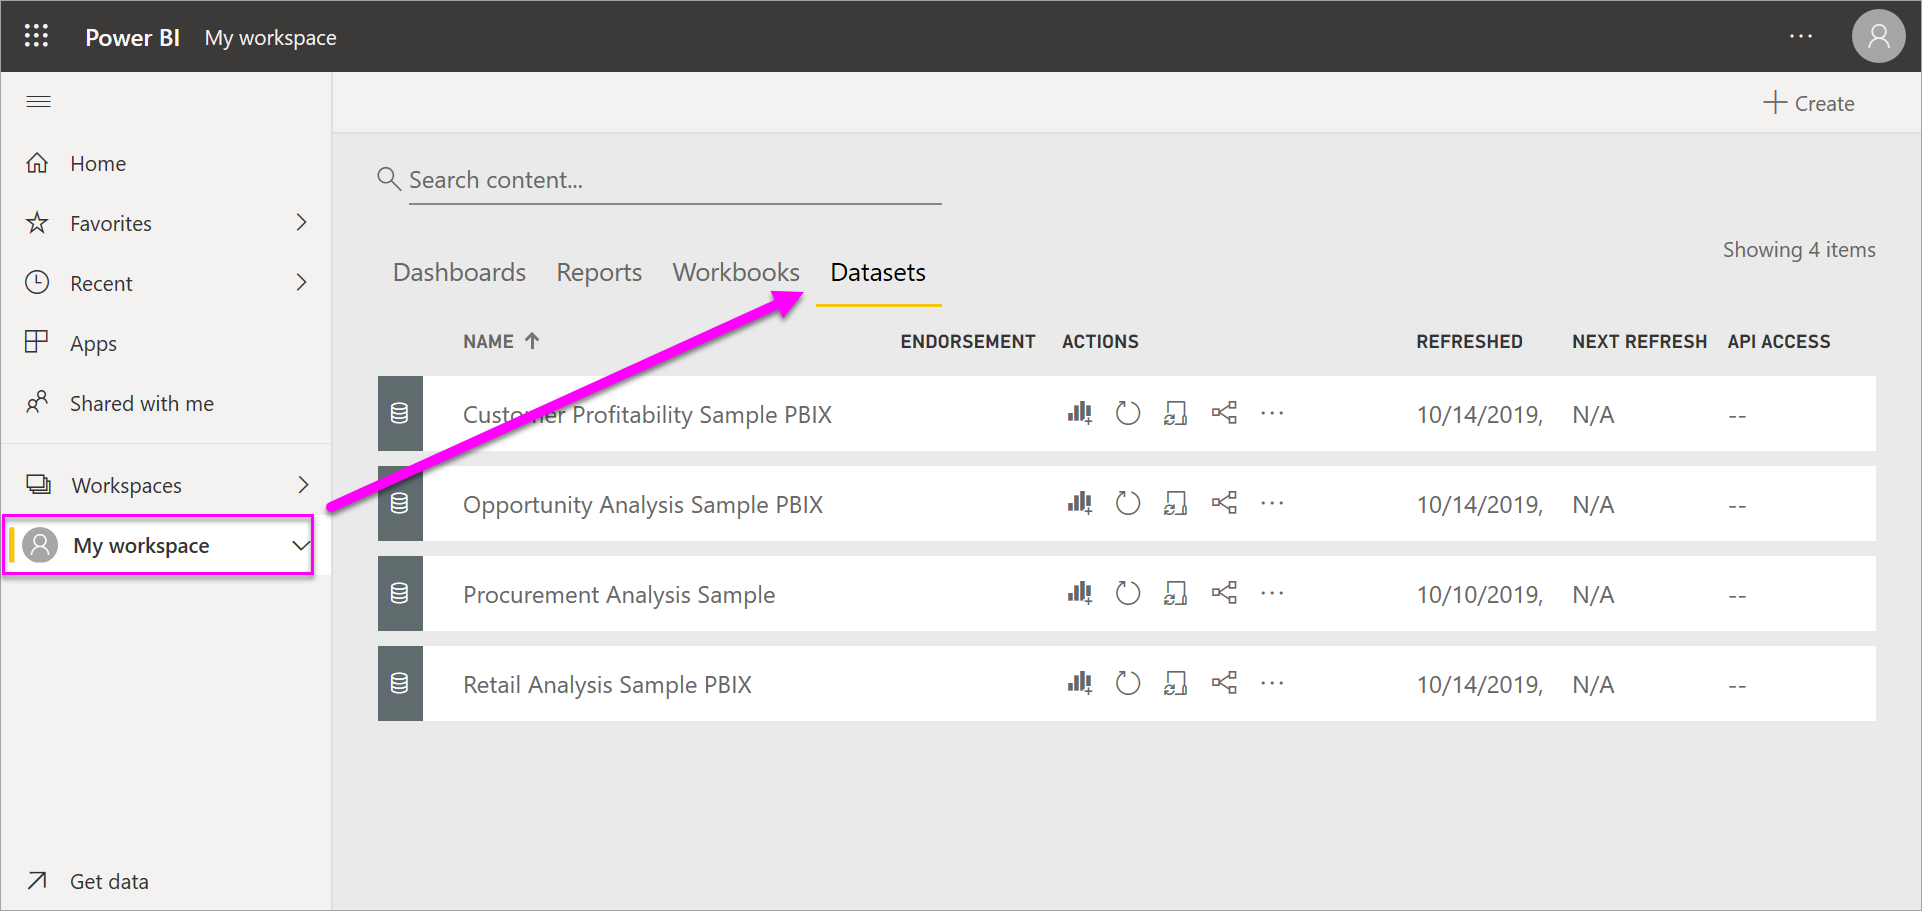
A dataset is a collection of data that designers import or connect to and then use to build reports and dashboards.
Each dataset represents a single source of data. For example, the source could be an Excel workbook on OneDrive, an on-premises SQL Server Analysis Services tabular dataset, or a Salesforce dataset. Power BI supports many different data sources.
Reports
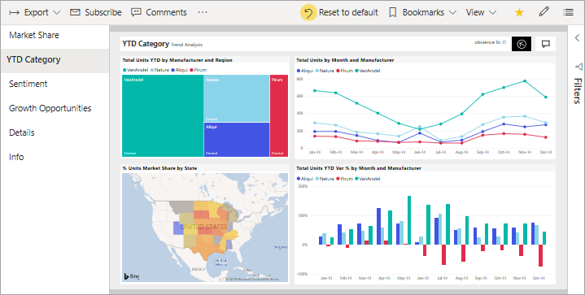
A Power BI report is one or more pages of visualizations, graphics, and text. All the visualizations in a report come from a single dataset. Designers build reports and share them with others; either individually or as part of an app.
Dashboards
A dashboard represents a customized graphical view of some subset of the underlying dataset(s). Designers build dashboards and share them with business users; either individually or as part of an app. A dashboard is a single canvas that has tiles, graphics, and text.
Apps
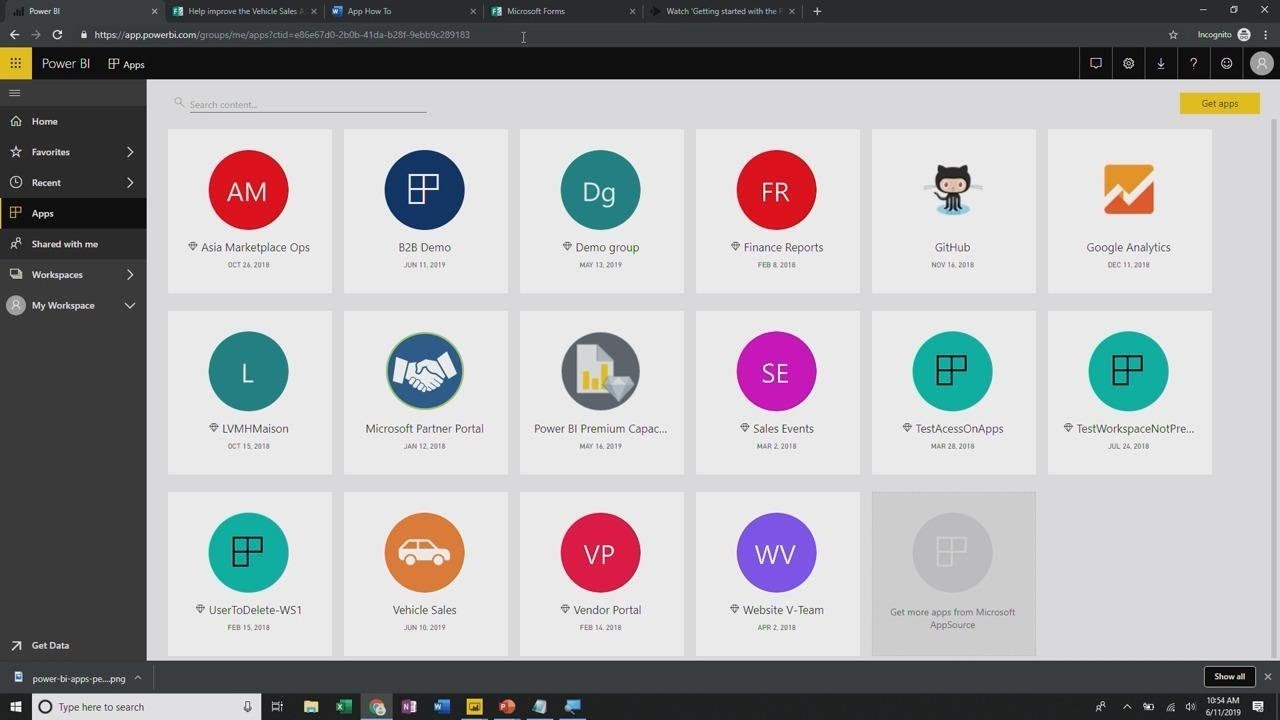
These collections of dashboards and reports organize related content together into a single package. Power BI designers build them in workspaces and share apps with individuals, groups, entire organizations, or the public.
Apps are easy to find and install in the Power BI service and on your mobile device. After you install an app, you don’t have to remember the names of a lot of different dashboards and reports. They’re all together in one app, in your browser, or on your mobile device.
We recently ran a webinar with Microsoft looking at data strategies for informed decision-making. During the webinar our special guest speaker from Microsoft took us through an overview of the entire Microsoft Power Platform toolset and IJYI CEO Chris Pont shared some examples of how IJYI uses PowerBI internally and for our customers. View the full webinar below:

About the author
IJYI Ltd
IJYI Ltd.